The primary goal of our safety efforts is to keep our employees safe by discovering what exposures they are dealing with and determining how best to eliminate those exposures. To do this, a great deal of data is gathered through Job Safety Briefings (JSBs), Safety Contacts, and Lighthouse Observations. Sharing that data and meaningful conclusions and insights has been a huge challenge. Beginning in January, we will have Safety Dashboard - an easier, streamlined way to see and utilize the valuable information gathered during these safety activities.
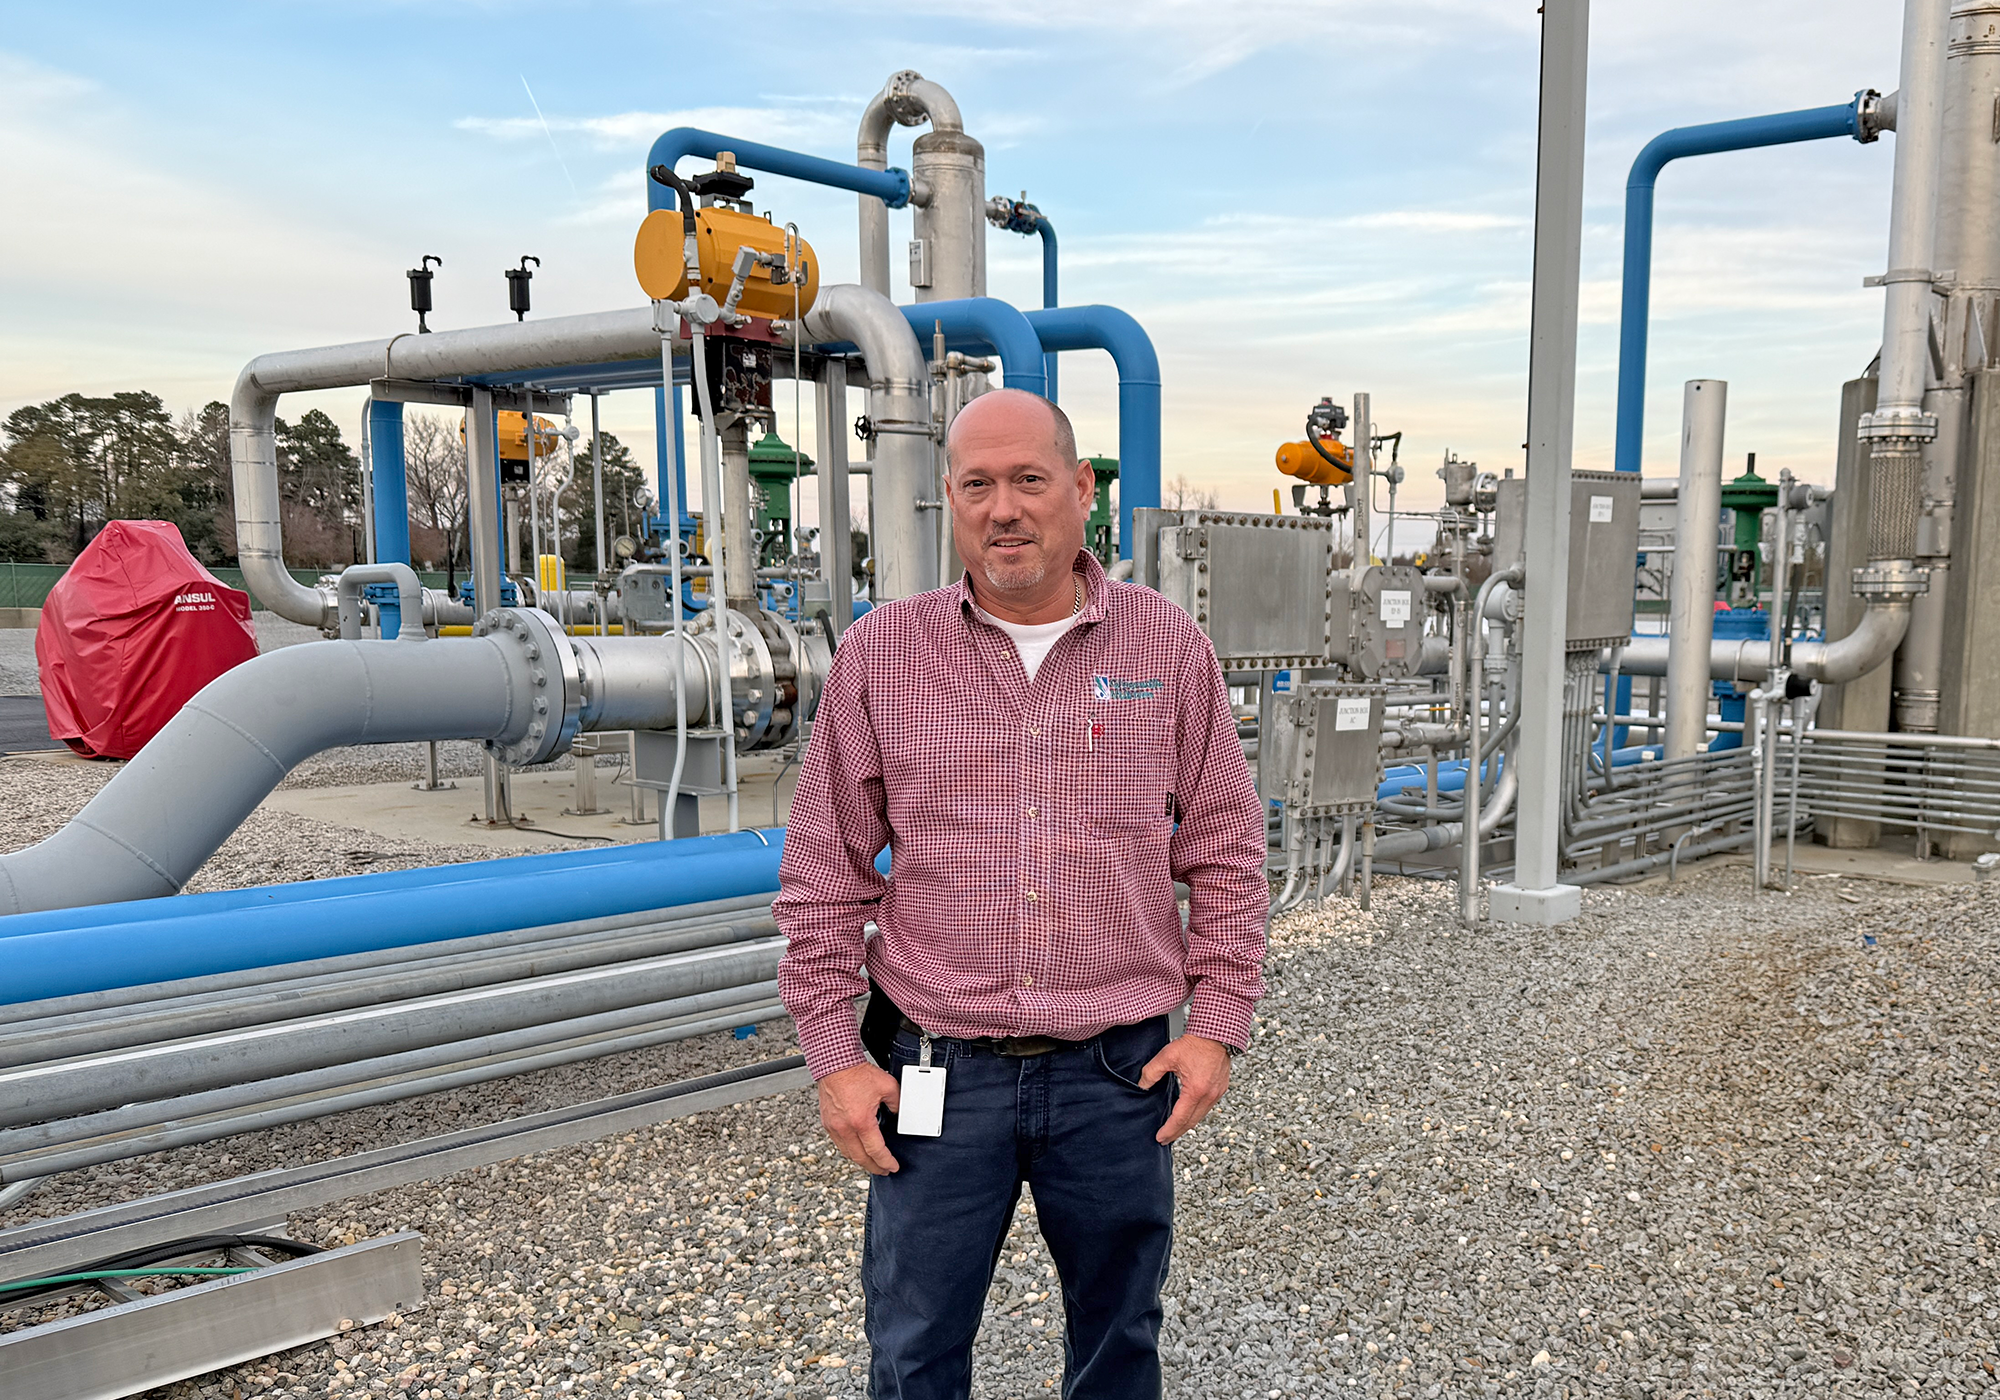
Because information is collected using different apps and processes for JSBs, Safety Contacts, and Lighthouse Observations, we needed a way to bring all that data together to form a data stream so the information could be consolidated. Once it’s consolidated, it’s easier to see trends and exposures. Water Resources Systems Engineer Scott Farmer took the lead in developing this new safety reporting system using PowerBI software that is customized to our needs.
Getting PowerBI set up to receive information from our various safety apps required that each safety process use the same language. Lighthouse, SafeAlign, and JSBs were often using different terminology to say the same thing, so changes were made in order to “speak the same language.” This will make it easier to see trends in exposures and to compare “apples to apples” rather than “Granny Smiths to Fujis.”
Once it’s operational, the Safety Dashboard will update automatically by receiving the data from the Lighthouse, SafeAlign, and JSB apps. Reports that show our top exposures and SIFs (exposures that could lead to significant injury or fatality) so that we can formulate plans to effectively eliminate or reduce those exposures.
Many thanks to Safety Culture Specialist Kelly Smith, Gas Distribution Engineer Carl Smith, Senior Systems Analyst I Aaron Johnson, Systems Analyst II Krystle Small, Gas Systems Technician III Mickey Dawson, Systems Analyst IV Max Wu, and Gas Engineering Coordinator Jason Cyphers who all played roles in getting the data and apps refined to where we can use them for this dashboard.
GUC is continually seeking ways to improve our safety efforts and keep our most important resource – our employees – safe. This new Safety Dashboard will help make safety communication across departments easier and more effective so that we can move closer to our goal of zero injuries each day.


